Spend Tracker Help
Learn how to track and analyze your spending
patterns effectively.
Getting Started
The Spend Tracker turns your bank statement exports into actionable insights. By uploading CSV files, you can visualize your cash flow and see how your spending aligns with popular budgeting rules.
Privacy & Security
Your privacy is our priority. While transaction files are processed on our secure servers to generate deep insights, we do not store any of your personal transaction details. Once your analysis is generated, the ephemeral data is cleared from our memory.
1. Data Input & Configuration
To begin, you'll need to upload your transaction history. We currently support CSV exports from Suncorp, ING, and ANZ.
- Transaction Files: You can upload multiple CSV files at once to analyze several accounts or months together.
- Budgeting Rule: Select a rule to compare your
actual spending against:
- 50/30/20: Needs (50%), Wants (30%), and Savings (20%).
- 70/20/10: Needs (70%), Savings/Debt (20%), and Wants (10%).
- 25/15/50/10: Growth (25%), Stability (15%), Essentials (50%), and Rewards (10%).
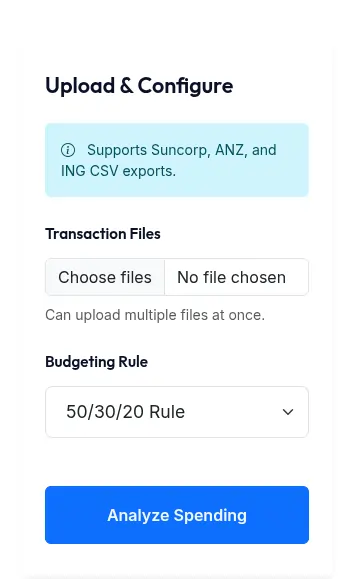
Uploading files and selecting rules
2. Result Summary
The summary provides a high-level view of your total cash flow for the analyzed period.
- Total Income: All positive transactions (salary, transfers in).
- Total Expense: All negative transactions (bills, shopping, transfers out).
- Total Saving: Your net balance (Income - Expense).
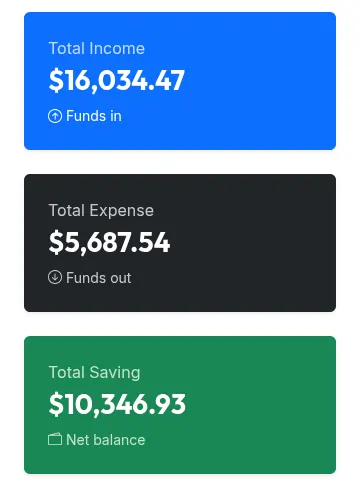
Instant financial health snapshot
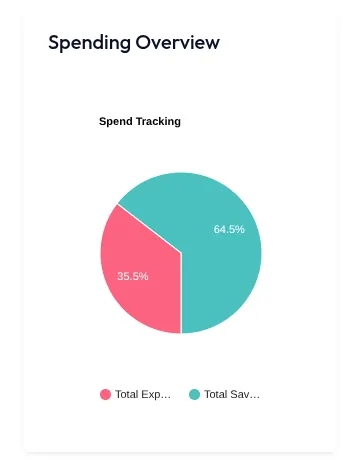
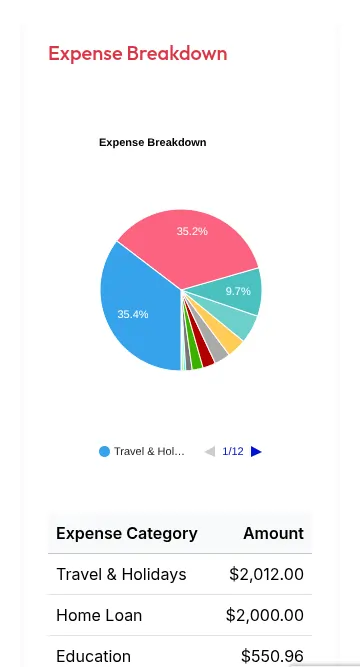
3. Spending Overview
This chart gives you a quick visual breakdown of where your money is going at a category level. It also calculates exactly what percentage of your total income is being consumed by expenses.
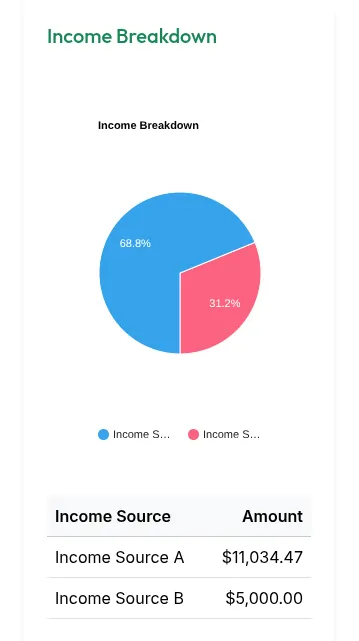
4. Income & Expense Breakdowns
These sections deep-dive into your cash flow sources and destinations. If some transactions are categorized as "Unknown", you can manually refine them.
Custom Tagging
In the detailed transaction tables, you can select custom tags for records. After choosing your tags, resubmit the analysis to see your charts update with the new classifications.
Note: Custom tags are stored in your browser's local memory. They will persist between sessions but will be cleared if you clear your browser cache.
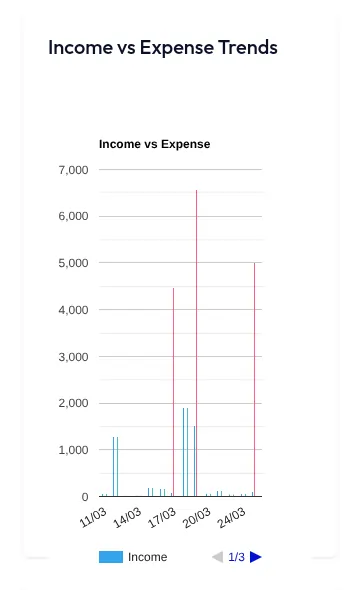
5. Income vs Expense Trend
Track how your spending fluctuates over time. This helps identify seasonal peaks or months where you may have overspent.
6. Top Spending by Description
Drill down into specific merchants or services. We group identical descriptions together so you can see your total spend with specific vendors.
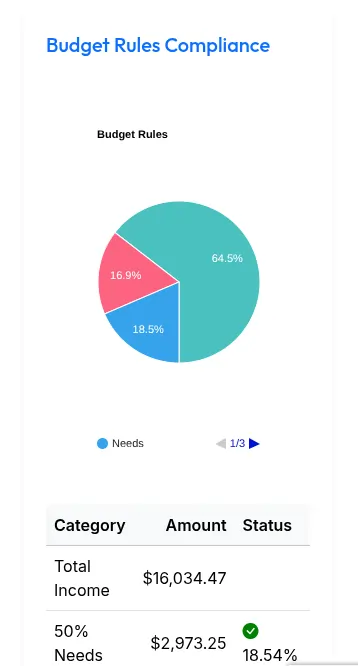
7. Budget Rules Result
Compare your actual spending against the budgeting rule you selected at the start. See if you're meeting your goals for needs, wants, and savings.